Stålberg Useum-
what I have used with amusement for 50 years
Contents
Introduction. 2
Think
Tank. 3
Double
lens for 3D pictures. 4
Sweller
and split sweep. 5
Singing
jittermeter 7
Color
coded signals. 8
Remote
signal analysis. 9
EEG
transmission via telephone. 10
Throat
microphone. 10
Simulation
of the electrical field using water capillaries. 10
Things
without photos. 13
Delayline. 13
Cooler: 13
Intercom.. 14
Voice
control of the EMG equipment 14
Ratemeter 15
Digital
tape analysis. 15
Combined
Multi- and Thermo-electrode. 16
Measuring
time with voltage, The “WOBBLER” 17
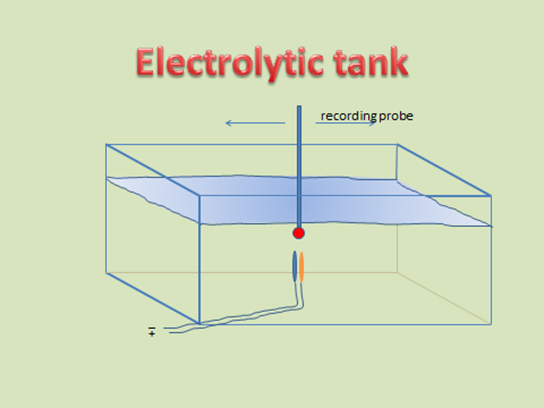
In order to study the electrical field around a dipole,
which can be used as a simple model to represent the depolarization in a muscle
membrane, we used a water filled tank of the size of a home aquarium. The tank
was filled with water. Two small silver coins (10 Swedish öre, available at the
time) were glued together and isolated from each other. A current was applied between
the coins. A probe was moved along the tank (perpendicular to the direction of
the coins) and a voltage profile was obtained as a diphasic signal. In
experiments, the distance between the generator and the recording probe was
varied. One important finding was the increase in signal amplitude when the recording
probe was just under the water surface. This was interpreted as a concentration
of currents due to restriction of the volume conductor.
This also happens in the SF recordings. The small
surface is surrounded by the isolating Araldite, which relatively speaking is
very large. This will increase the amplitude by a factor of 2 compared to a
wire recording without a shielding wall. We called this the “Wall effect”.
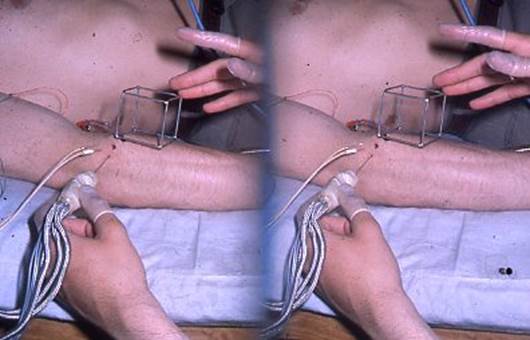
In attempts to exactly
define the 3D dimensional position of the electrode inserted into the muscle we
used a double lens adapted to an amateur camera, Retina IIIC. This gave two
pictures from slightly different angles. In the picture field we placed a cube
constructed from metal with the sides of 10 cm. With a special viewer (or you
may manage to adjust your eyes properly) you will see a 3D picture. From these
pictures the exact position of the electrode could be estimated, but the method
was never used in praxis. This was the principle that had been used by archeologists
e.g. to measure the pyramids with cameras at the wings of an aero plane.
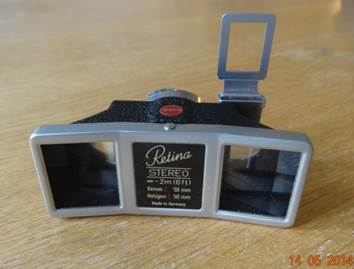
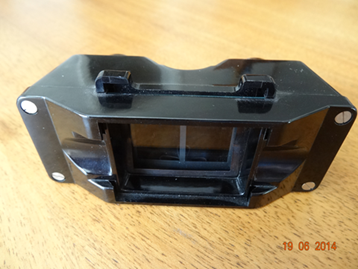
Double
lens objective and viewer
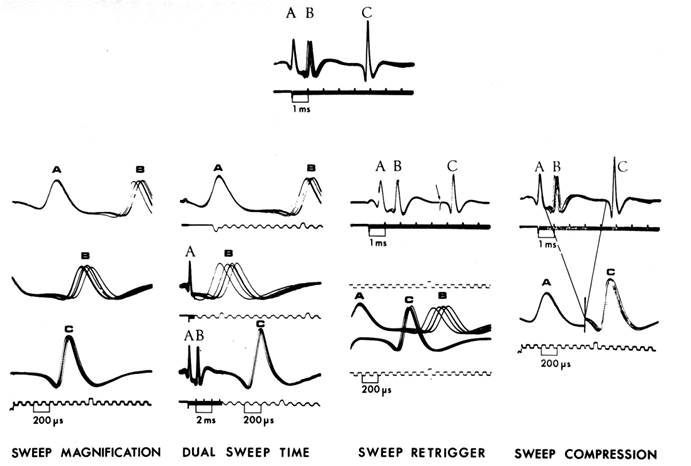
During the time of analogue oscilloscopes, one had
access to the saw tooth signal (X-axis signal). On a separate channel (dual
sweep Tektronix 565) a faster sweep speed could be used starting anywhere along
the position of sweep 1 which could be used for different purposes. One was to
initiate and amplitude change during the sweep time of channel 2. In this way,
separate parts of the signal could be amplified or attenuated depending on
situation. With later digital instruments it has been easy to accomplish this
and is a routine feature of the different amplifications used e.g. in F-was studies.
Similarly this could be used to give different sections
of a trace different time base. This split seep speed has not been implemented
in EMG equipment yet.
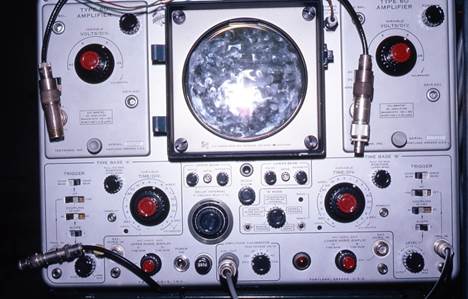
Fig of
Tektronix 565 oscilloscope
Sweller
with segments of amplified and attenuated signals
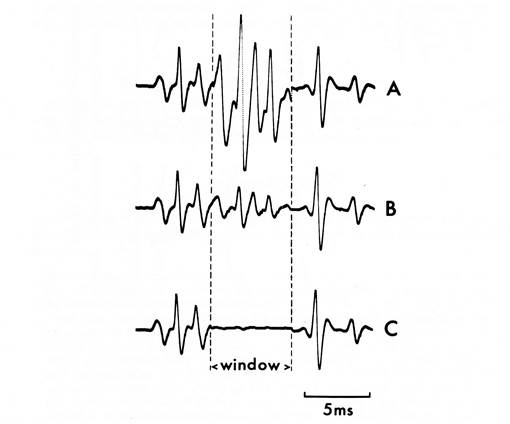
Signals
segment with different sweep speed
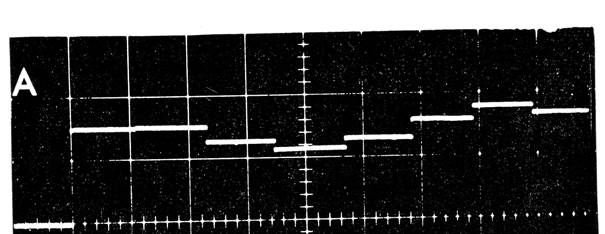
In an early jittermeter, the running jitter values
(calculated on 50 discharges) were transformed to a DC level. A
continuous display was then obtained of the jitter during activity.
This DC level was also used to frequency modulate a
tone, with a height proportional to the jitter. In other words we could listen
to the jitter. We could also set a discriminant level, so that only abnormal
jitter values were heard in the loud speaker.
Analogue output from the jittermeter. One division
corresponds to jitter values for 50 discharges.
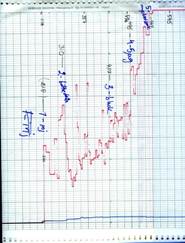
Curare
experiment Long term recording
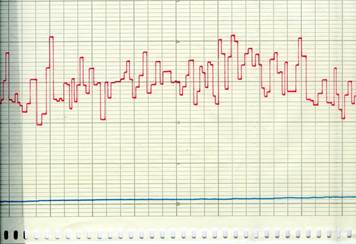
During the development of the MUP analysis program, it
was of interest to detect discharges with a fast rising slope. This was done
on-line by calculating the derivative of the signal. A derivate values less
than a given value change the color of the displayed signal and it was thus
directly see signals with sharp rising phase. This may have application in some
types of EMG recordings, not yet implemented.
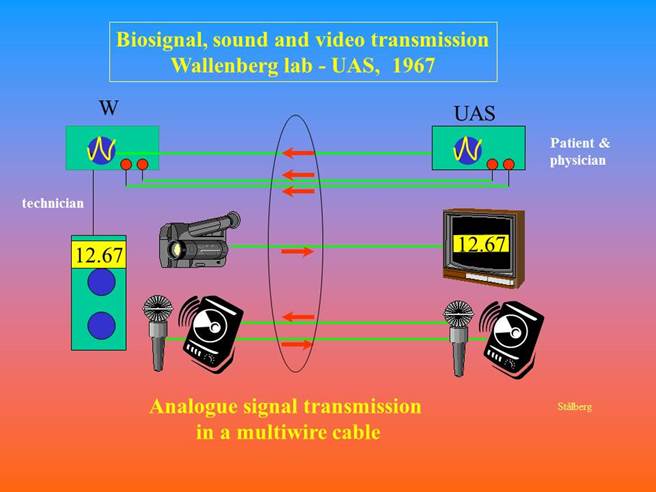
When I in 1967 moved to the clinical neurophysiology
department of the Academic hospital, I still had analysis equipment in my
previous lab across the street. To allow analysis of signals from patients from
the EMG we had to use the research equipment. Swedish Telecompany made a large,
generous and unique effort in digging a 300 m 14 double paired cable under the
street with connection of the EMG lab. Fourteen line amplifiers compensated for
amplitude loss. In this cable we transferred EMG signals, video,
bilateral control signals for the oscilloscopes and sound (a pilot´s throat
mike ). This was the first telemedicine transmission of biological signals in
Sweden. We used this connection for some years in routine quite successfully
until we could afford separate analysis equipment in the EMG lab.
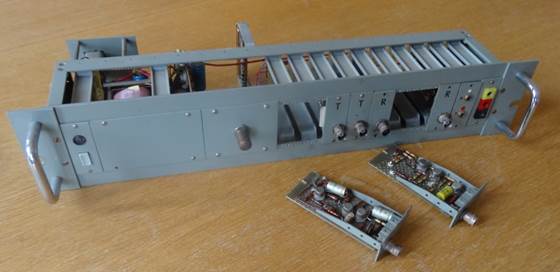
Line
amplifier for the long distance transmission
 EEG
transmission via telephone
EEG
transmission via telephone
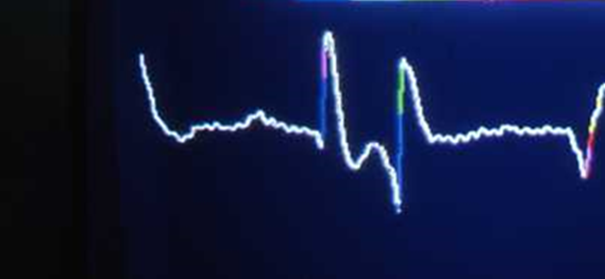
In an early attempt (1969) to transmit
neurophysiological signals over long distances, we tried a system with
telephone transmission. The EEG signal was frequency modulated around a carrier
frequency of 1300Hz (optimized for telephone lines). The signal was
correspondingly demodulated on the receiver side. We used only one channel.
More channels can be used, using separated carrier frequencies. We used this
for testing between Uppsala and Gävle also with ECG signals. Multichannel
systems on the same principle was then used between hospitals in Göteborg.
|

|
Sent
|
|

|
Received
|
Single channel EEG recording transmitted over telephone
line from Swedish westcoast (Edshagen) to the Dept Clin Neurophysiology in
Uppsala. EEG signals superimpose nicely. Some short artifacts are seen on the
received signal.
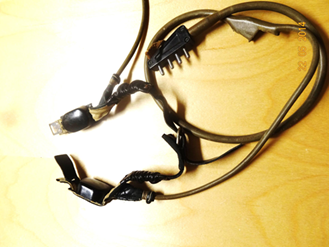
The sound system in the telemedicine connection we used
a pilot´s throat microphone to suppress sound from the EMG and other
surrounding sound. Worked fine but maybe somewhat odd for the patient to see
the doctor´s equipment.
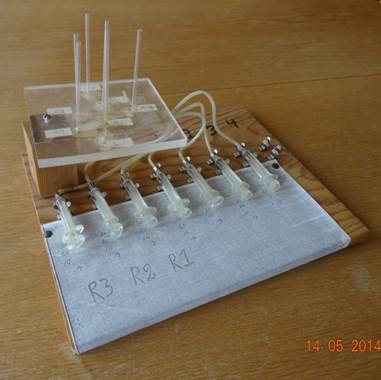
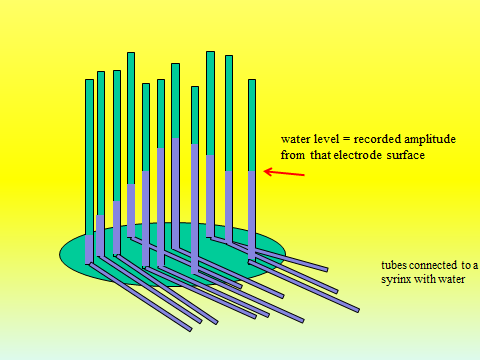
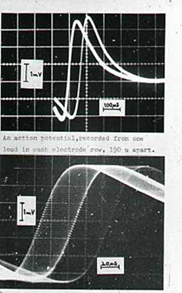
Multi electrode recordings from one muscle fiber seen
with 12 electrode the electrical field can be studied. One analogue method was
to place vertical glass capillaries in a scaled pattern exactly like the
electrode surfaces in the multi electrode. The glass capillaries were filled
with colored water corresponding to the amplitude obtained from
the electrodes. In this way an analogue picture was obtained of the electrical
field around the electrode.
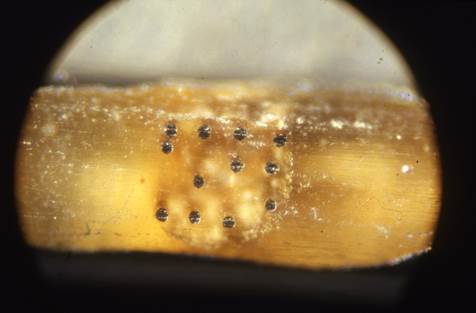
Detail of the electrode surfaces in the multielectrode
used to study signals distribution
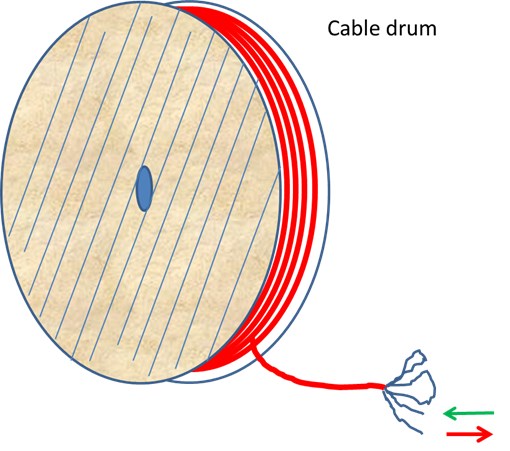
When triggering a signal on the oscilloscope, segments
before the trigger could initially not be seen. We used the speed of electricity
(light) along a metal lead (speed of light) to obtain a delay. A drum (about
1.5 m in diameter) with 1 km of a 14 pair cable was purchased and placed in the
lab. The thread ends are connected a so 28 km of cable was obtained. This gave
a delay of 93,4 µs, enough for us.
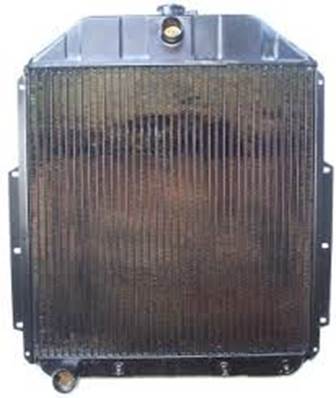
Pharmacological institution did not have air condition.
We mounted a cooler of a truck (similar to the one in Fig) in the window and a
fan in front to remove some of the heat from all instruments.
The lab had two rooms. For communication we used a
rubber tube in a hole through the wall, with funnels at both ends. This was
also used to send white smoke from Ekstedt´s cigar when we accepted the
application of a new engineer (c.f. procedure for new Pope).

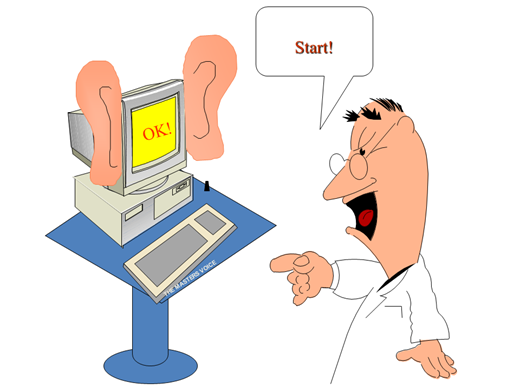
In the 1982, we tried to control some the functions in
the EMG equipment (Medelec, MS92) by voice. At that time we used an Apple IIe
computer with Cognivox™. Functions such as STIM,
CAMERA, START-STOP (TA analysis) were used. The program worked pretty well with
short commands. For longer word sequences the detection accuracy was too low to
be used in routine (you cannot risk a train of stimuli if you cough!) and also
required individual voice calibration. If I had a sore throat, the system
denied obeying.
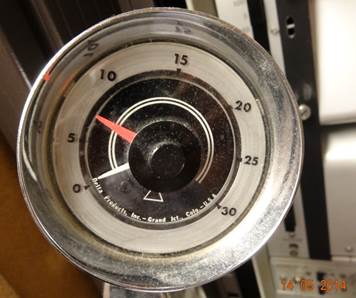
Sometime it was important to have a given firing rate
of the muscle action potentials. With electrical stimulation this was directly
obtained, but with woluntary activation we had to give the patient a good feeed
back. An early method was to use a tachometer from a car to which the trig
pulses corresponding to the triggered sweep were fed. Now the patient could
learn to keep a pretty constant rate with with the range of 7Hz-30Hz.
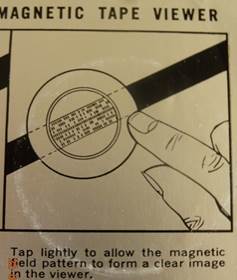
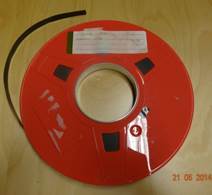
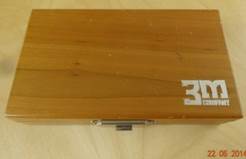
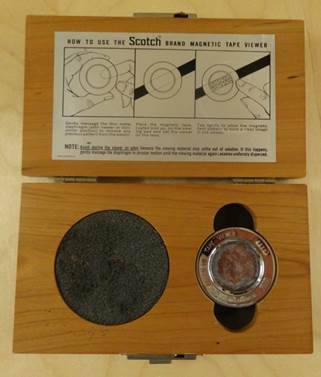
When we purchased an incremental digital 8 channel tape
recorder, we also made sure that we could detect possible data errors. A small
box with magnetic properties made the job, bit by bit. The tape was place over a
magnetic area and the “0” and “1” digits became visible!
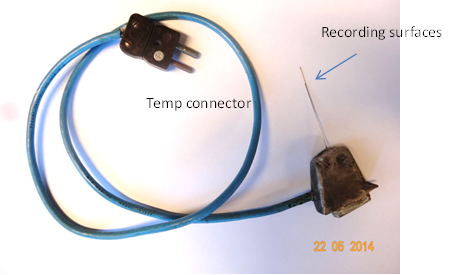
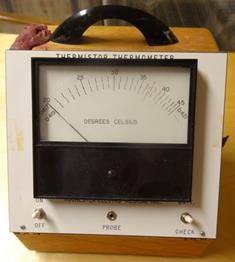
To study the effect of temperature on propagation
velocity we used a multielectrode with an inbuilt thermoprobe. (for other electrodes
see separate “Electro-tek”)

In the 60-ties, before we had a time interval counter,
we had to measure time by other means. One trick that could be used to measure
time between two parallel signals (for propagation velocity across a
multielectrode) was to superimpose a sine wave (1KHz) horizontally. The
amplitude was adjusted until the sine waves met and a white line was seen. The
amplitude was calibrated into µsec. The accuracy was
better than 1 µsec.
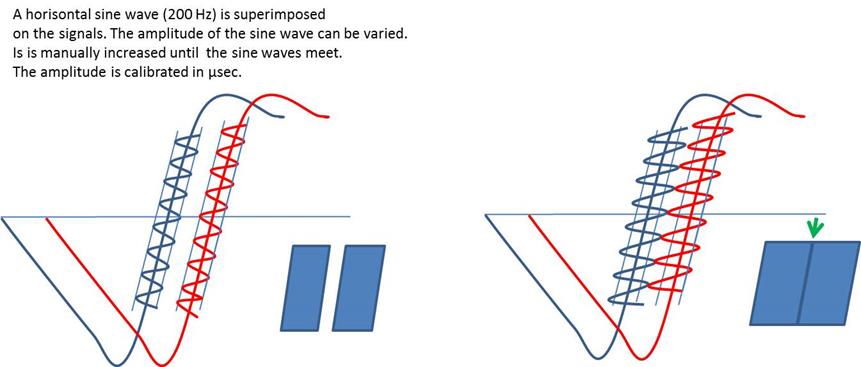
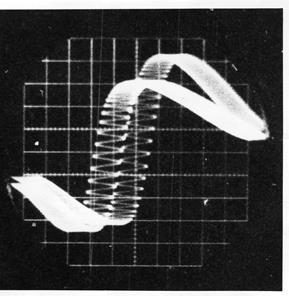
Low
frequency to demonstrate the principle - 1KHz
Some of these things are now Usual, some Museal